Multiple Choice
Figure 3.8
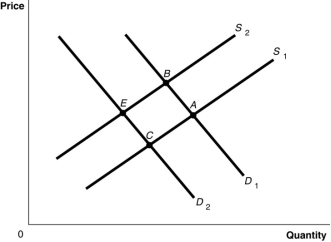
-Refer to Figure 3.8. The graph in this figure illustrates an initial competitive equilibrium in the market for apples at the intersection of D₁ and S₁ (point A) . If there is an increase in the wages of apple workers and an increase in the price of oranges, a substitute for apples, the equilibrium could move to which point?
A) none of the points shown
B) B
C) C
D) E
Correct Answer:

Verified
Correct Answer:
Verified
Q48: Quantity supplied refers to the amount of
Q144: Since more cars come equipped with navigation
Q145: Some graziers can raise either cattle or
Q146: A decrease in the equilibrium quantity for
Q148: Figure 3.8<br> <img src="https://d2lvgg3v3hfg70.cloudfront.net/TB3087/.jpg" alt="Figure 3.8
Q154: Figure 3.1<br> <img src="https://d2lvgg3v3hfg70.cloudfront.net/TB3087/.jpg" alt="Figure 3.1
Q176: Figure 3-1<br> <img src="https://d2lvgg3v3hfg70.cloudfront.net/TB4193/.jpg" alt="Figure 3-1
Q186: If in the market for oranges the
Q196: Figure 3-5<br> <img src="https://d2lvgg3v3hfg70.cloudfront.net/TB4193/.jpg" alt="Figure 3-5
Q207: The income effect explains why there is