Multiple Choice
Suppose that the data in the following table reflects the prices in an economy. What is the inflation rate in between 2017 and 2018?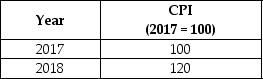
A) 2%
B) 5%
C) 20%
D) 10%
Correct Answer:

Verified
Correct Answer:
Verified
Related Questions
Q48: Looking at the following table, real average
Q49: Which of the following is a correct
Q50: Of the market basket that makes up
Q51: 'Cost-push inflation' can be caused by:<br>A)a high
Q52: What is caused by high anticipated inflation?<br>A)Real
Q54: When the price of petrol rises, some
Q55: Who, of the following options, does not
Q56: From the data in the following table
Q57: If the CPI changes from 125 to
Q58: If the real interest rate is 8%