Multiple Choice
From the data in the following table we can say that the cost of living rose by ________ between 2017 and 2018.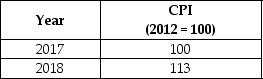
A) 2%
B) 5%
C) 8%
D) 13%
Correct Answer:

Verified
Correct Answer:
Verified
Related Questions
Q51: 'Cost-push inflation' can be caused by:<br>A)a high
Q52: What is caused by high anticipated inflation?<br>A)Real
Q53: Suppose that the data in the following
Q54: When the price of petrol rises, some
Q55: Who, of the following options, does not
Q57: If the CPI changes from 125 to
Q58: If the real interest rate is 8%
Q59: To calculate real wages in Year 1,
Q60: Which of the following can cause cost-push
Q61: The 'real rate' of interest is the:<br>A)nominal