Multiple Choice
Figure 3-1
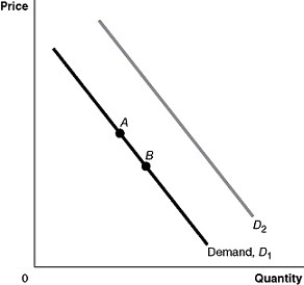
-Refer to Figure 3-1.An increase in population would be represented by a movement from
A) A to B.
B) B to A.
C) D₁ to D₂.
D) D₂ to D₁.
Correct Answer:

Verified
Correct Answer:
Verified
Q223: Holding everything else constant, a decrease in
Q224: Studies have shown links between calcium consumption
Q225: A decrease in the equilibrium quantity for
Q226: In 2004, hurricanes destroyed a large portion
Q227: Which of the following would cause the
Q229: A normal good is a good for
Q230: In 2004, hurricanes destroyed a large portion
Q231: A positive technological change will cause the
Q232: Figure 3-7<br> <img src="https://d2lvgg3v3hfg70.cloudfront.net/TB4193/.jpg" alt="Figure 3-7
Q233: Figure 3-7<br> <img src="https://d2lvgg3v3hfg70.cloudfront.net/TB4193/.jpg" alt="Figure 3-7