Multiple Choice
Figure 5-2
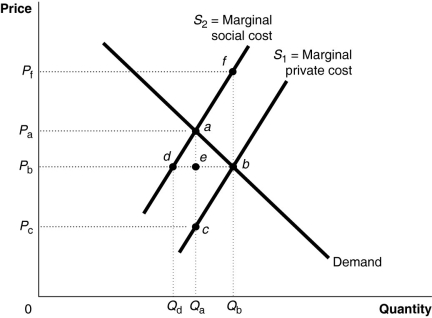
Figure 5-2 shows a market with a negative externality.
-Refer to Figure 5-2.The efficient output level is
A) Qd.
B) Qb.
C) Qₐ.
D) Qb - Qd.
Correct Answer:

Verified
Correct Answer:
Verified
Q201: Economists argue that the level of pollution
Q202: Figure 5-9<br> <img src="https://d2lvgg3v3hfg70.cloudfront.net/TB4193/.jpg" alt="Figure 5-9
Q203: Which of the following displays these two
Q204: The basic cause of deadweight losses from
Q205: For certain public projects such as building
Q207: Private costs<br>A)are borne by producers of a
Q208: Figure 5-2<br> <img src="https://d2lvgg3v3hfg70.cloudfront.net/TB4193/.jpg" alt="Figure 5-2
Q209: The marginal private cost of a good
Q210: If there is pollution in producing a
Q211: Article Summary<br>According to the online real estate