Multiple Choice
Figure 10-2
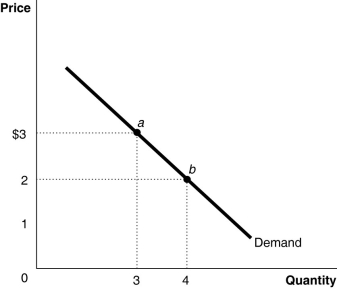
Figure 10-2 represents the demand for ice cream cones.
-Refer to Figure 10-2.When the price of ice cream cones increases from $2 to $3, quantity demanded decreases from 4 ice cream cones to 3 ice cream cones.This change in quantity demanded is due to
A) the price and output effects.
B) the income and substitution effects.
C) the law of diminishing marginal utility.
D) the fact that marginal willingness to pay falls.
Correct Answer:

Verified
Correct Answer:
Verified
Q252: Table 10-2<br> <img src="https://d2lvgg3v3hfg70.cloudfront.net/TB4193/.jpg" alt="Table 10-2
Q253: Giffen goods<br>A)are theoretical and have never been
Q254: Figure 10-3<br> <img src="https://d2lvgg3v3hfg70.cloudfront.net/TB4193/.jpg" alt="Figure 10-3
Q255: In making decisions about what to consume,
Q256: Explain the concept of network externalities.
Q258: Figure 10-7<br> <img src="https://d2lvgg3v3hfg70.cloudfront.net/TB4193/.jpg" alt="Figure 10-7
Q259: The income effect due to a price
Q260: The economic model of consumer behavior predicts
Q261: Figure 10-1<br> <img src="https://d2lvgg3v3hfg70.cloudfront.net/TB4193/.jpg" alt="Figure 10-1
Q262: Many people leave their servers tips in