Figure 10-7 the Above Panels Show Various Combinations of Indifference Curves and Combinations
Multiple Choice
Figure 10-7
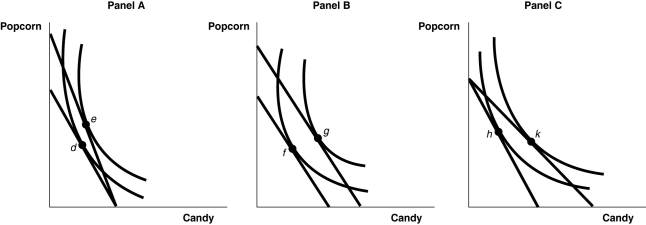
The above panels show various combinations of indifference curves and budget constraints for two products: Popcorn and Candy.
-Refer to Figure 10-7.Which diagram demonstrates a decrease in total utility following an increase in the price of candy?
A) the movement from e to d in Panel A
B) the movement from g to f in Panel B
C) the movement from k to h in Panel C
D) none of the above
Correct Answer:

Verified
Correct Answer:
Verified
Q253: Giffen goods<br>A)are theoretical and have never been
Q254: Figure 10-3<br> <img src="https://d2lvgg3v3hfg70.cloudfront.net/TB4193/.jpg" alt="Figure 10-3
Q255: In making decisions about what to consume,
Q256: Explain the concept of network externalities.
Q257: Figure 10-2<br> <img src="https://d2lvgg3v3hfg70.cloudfront.net/TB4193/.jpg" alt="Figure 10-2
Q259: The income effect due to a price
Q260: The economic model of consumer behavior predicts
Q261: Figure 10-1<br> <img src="https://d2lvgg3v3hfg70.cloudfront.net/TB4193/.jpg" alt="Figure 10-1
Q262: Many people leave their servers tips in
Q263: What is the endowment effect?<br>A)the phenomenon that