Multiple Choice
Figure 11-11
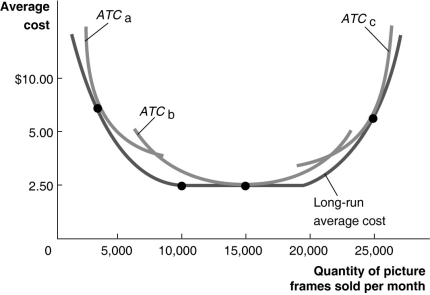
Figure 11-11 illustrates the long-run average cost curve for a firm that produces picture frames. The graph also includes short-run average cost curves for three firm sizes: ATCₐ, ATCb and ATCc.
-Refer to Figure 11-11.The minimum efficient scale of output is reached at what rate of output?
A) 10,000 workers
B) 5,000 picture frames
C) 20,000 picture frames
D) 10,000 picture frames
Correct Answer:

Verified
Correct Answer:
Verified
Q13: Table 11-8<br> <img src="https://d2lvgg3v3hfg70.cloudfront.net/TB4193/.jpg" alt="Table 11-8
Q14: Figure 11-13<br> <img src="https://d2lvgg3v3hfg70.cloudfront.net/TB4193/.jpg" alt="Figure 11-13
Q15: Figure 11-14<br> <img src="https://d2lvgg3v3hfg70.cloudfront.net/TB4193/.jpg" alt="Figure 11-14
Q16: Academic book publishers hire editors, designers, and
Q19: Figure 11-5<br> <img src="https://d2lvgg3v3hfg70.cloudfront.net/TB4193/.jpg" alt="Figure 11-5
Q20: Table 11-2<br> <img src="https://d2lvgg3v3hfg70.cloudfront.net/TB4193/.jpg" alt="Table 11-2
Q21: The explicit cost of production is also
Q22: Stan owns a software design business.He does
Q23: Which of the following are implicit costs
Q247: The formula for total fixed cost is<br>A)