Multiple Choice
Figure 11-14
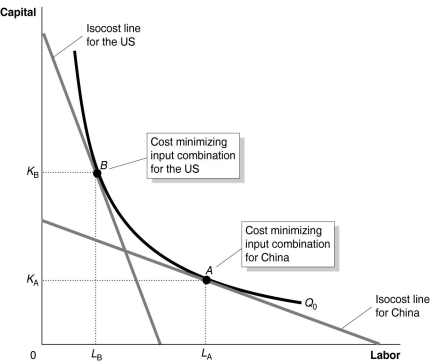
Figure 11-14 shows the optimal input combinations for the production of a given quantity of cotton in the United States and in China.
-Refer to Figure 11-14.Consider the following statements:
A.For each country, the marginal product per dollar spent on labor equals to the marginal product per dollar spent on capital.
B.The price of labor is relatively higher in the United States than in China and the price of capital is relatively lower in the United States than in China.
C.The price of labor and the price of capital are relatively higher in the United States than in China.
Based on the figure, which of the statements above is true?
A) All of the statements are true.
B) statements a and c only
C) statements a and b only
D) statements b and c only
Correct Answer:

Verified
Correct Answer:
Verified
Q10: Figure 11-1<br> <img src="https://d2lvgg3v3hfg70.cloudfront.net/TB4193/.jpg" alt="Figure 11-1
Q11: As output increases, average fixed cost gets
Q12: In his book The Wealth of Nations,
Q13: Table 11-8<br> <img src="https://d2lvgg3v3hfg70.cloudfront.net/TB4193/.jpg" alt="Table 11-8
Q14: Figure 11-13<br> <img src="https://d2lvgg3v3hfg70.cloudfront.net/TB4193/.jpg" alt="Figure 11-13
Q16: Academic book publishers hire editors, designers, and
Q18: Figure 11-11<br> <img src="https://d2lvgg3v3hfg70.cloudfront.net/TB4193/.jpg" alt="Figure 11-11
Q19: Figure 11-5<br> <img src="https://d2lvgg3v3hfg70.cloudfront.net/TB4193/.jpg" alt="Figure 11-5
Q20: Table 11-2<br> <img src="https://d2lvgg3v3hfg70.cloudfront.net/TB4193/.jpg" alt="Table 11-2
Q247: The formula for total fixed cost is<br>A)