Multiple Choice
Figure 12-17
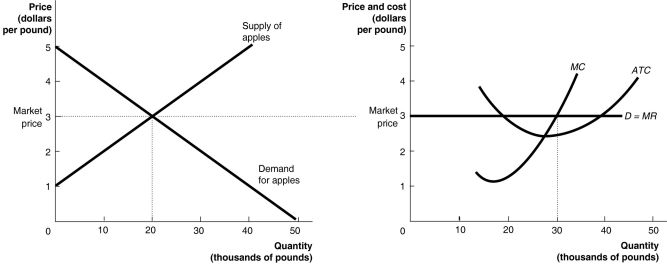
The graphs in Figure 12-17 represent the perfectly competitive market demand and supply curves for the apple industry and demand and cost curves for a typical firm in the industry.
-Refer to Figure 12-17.The graphs depict a short-run equilibrium.How will this differ from the long-run equilibrium? (Assume this is a constant-cost industry.)
A) Fewer firms will be in the market in the long run than in the short run.
B) The price will be higher in the long run than in the short run.
C) The market supply curve will be further to the left in the long run than in the short run.
D) The firm's profit will be lower in the long run than in the short run.
Correct Answer:

Verified
Correct Answer:
Verified
Q18: Figure 12-9<br> <img src="https://d2lvgg3v3hfg70.cloudfront.net/TB4193/.jpg" alt="Figure 12-9
Q125: Which of the following statements is true?<br>A)A
Q126: Assume that the market for cage-free eggs
Q127: In a perfectly competitive industry, in the
Q128: Which of the following does not hold
Q129: A firm will break even when<br>A)P =
Q131: Hogrocket, which developed the Tiny Invaders game
Q132: In the short run, if price falls
Q133: Figure 12-2<br> <img src="https://d2lvgg3v3hfg70.cloudfront.net/TB4193/.jpg" alt="Figure 12-2
Q135: If a typical firm in a perfectly