Multiple Choice
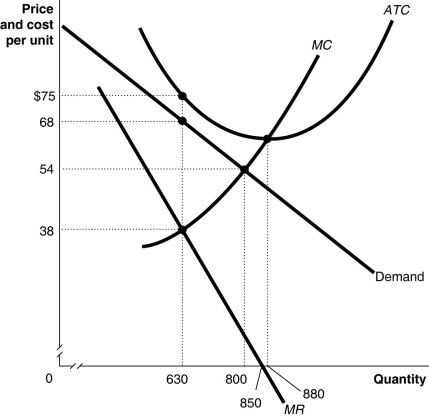
Figure 15-3

Figure 15-3 above shows the demand and cost curves facing a monopolist.
-Refer to Figure 15-3.Suppose the monopolist represented in the diagram above produces positive output.What is the profit-maximizing/loss-minimizing output level?
A) 630 units
B) 800 units
C) 850 units
D) 880 units
Correct Answer:

Verified
Correct Answer:
Verified
Q125: If a monopolist's marginal revenue is $25
Q126: After having a monopoly in the diamond
Q127: A virtuous cycle occurs<br>A)when lobbyists petition members
Q128: A public franchise<br>A)is a corporation that is
Q129: Which two factors make regulating mergers complicated?<br>A)First,
Q131: Assume a hypothetical case where an industry
Q132: Identify the type of merger in each
Q133: To maximize profit, a monopolist will produce
Q134: Figure 15-6<br> <img src="https://d2lvgg3v3hfg70.cloudfront.net/TB4193/.jpg" alt="Figure 15-6
Q135: Explain why the monopolist has no supply