Multiple Choice
Figure 15-6
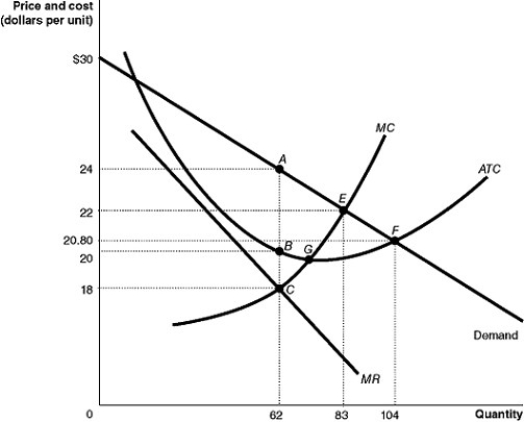
Figure 15-6 shows the cost and demand curves for a monopolist.
-Refer to Figure 15-6.The monopolist's total revenue is
A) $1,116.
B) $1,488.
C) $1,726.40
D) $1,826.
Correct Answer:

Verified
Correct Answer:
Verified
Q129: Which two factors make regulating mergers complicated?<br>A)First,
Q130: Figure 15-3<br> <img src="https://d2lvgg3v3hfg70.cloudfront.net/TB4193/.jpg" alt="Figure 15-3
Q131: Assume a hypothetical case where an industry
Q132: Identify the type of merger in each
Q133: To maximize profit, a monopolist will produce
Q135: Explain why the monopolist has no supply
Q136: In discussions of barriers to entry, what
Q137: Economists played a key role in the
Q138: How do the price and quantity of
Q139: Figure 15-3<br> <img src="https://d2lvgg3v3hfg70.cloudfront.net/TB4193/.jpg" alt="Figure 15-3