Essay
Figure 15-14
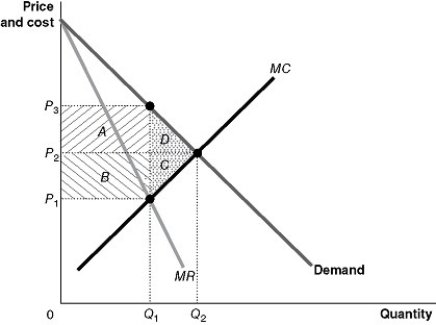
-Refer to Figure 15-14.From the monopoly graph above, identify the following:
a.The profit-maximizing price
b.The profit-maximizing quantity
c.The area representing deadweight loss
d.The area representing the transfer of consumer surplus to the monopoly
Correct Answer:

Verified
a.Price = P₃
b.Quantity = Q₁
c...View Answer
Unlock this answer now
Get Access to more Verified Answers free of charge
Correct Answer:
Verified
b.Quantity = Q₁
c...
View Answer
Unlock this answer now
Get Access to more Verified Answers free of charge
Q115: Assume a hypothetical case where an industry
Q116: Figure 15-9<br> <img src="https://d2lvgg3v3hfg70.cloudfront.net/TB4193/.jpg" alt="Figure 15-9
Q117: Microsoft hires marketing and sales specialists to
Q119: Merger guidelines developed by the U.S.Department of
Q121: How does a network externality serve as
Q122: Economic efficiency in a free market occurs
Q123: A profit-maximizing monopoly produces a lower output
Q124: Baxter International, a manufacturer of hospital supplies,
Q125: If a monopolist's marginal revenue is $25
Q196: Figure 15-2<br> <img src="https://d2lvgg3v3hfg70.cloudfront.net/TB4193/.jpg" alt="Figure 15-2