Multiple Choice
Figure 15-15
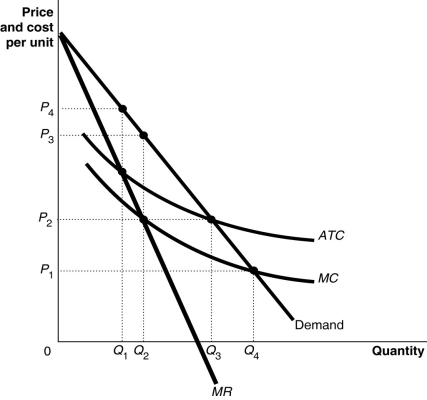
Figure 15-15 shows the cost and demand curves for the Erickson Power Company.
-Refer to Figure 15-15.The firm would maximize profit by producing
A) Q₁ units.
B) Q₂ units.
C) Q₃ units.
D) Q₄ units.
Correct Answer:

Verified
Correct Answer:
Verified
Q109: Figure 15-8<br> <img src="https://d2lvgg3v3hfg70.cloudfront.net/TB4193/.jpg" alt="Figure 15-8
Q110: If a monopolist's price is $50 at
Q111: The possibility that the economy may benefit
Q112: According to the Department of Justice merger
Q113: There are several types of barriers to
Q115: Assume a hypothetical case where an industry
Q116: Figure 15-9<br> <img src="https://d2lvgg3v3hfg70.cloudfront.net/TB4193/.jpg" alt="Figure 15-9
Q117: Microsoft hires marketing and sales specialists to
Q119: Merger guidelines developed by the U.S.Department of
Q196: Figure 15-2<br> <img src="https://d2lvgg3v3hfg70.cloudfront.net/TB4193/.jpg" alt="Figure 15-2