Multiple Choice
Figure 18-1
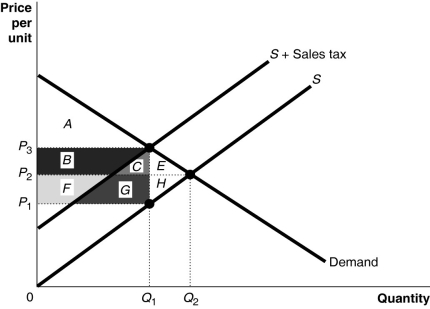
-Refer to Figure 18-1.Area B + C represents
A) the portion of sales tax revenue borne by consumers.
B) the portion of sales tax revenue borne by producers.
C) the excess burden of the sales tax.
D) sales tax revenue collected by the government.
Correct Answer:

Verified
Correct Answer:
Verified
Q121: A tax is efficient if it imposes
Q122: For a given supply curve, how does
Q123: Figure 18-1<br> <img src="https://d2lvgg3v3hfg70.cloudfront.net/TB4193/.jpg" alt="Figure 18-1
Q124: A common belief among political analysts is
Q125: Table 18-9<br> <img src="https://d2lvgg3v3hfg70.cloudfront.net/TB4193/.jpg" alt="Table 18-9
Q127: The voting paradox suggests that the "voting
Q128: If you pay $2,000 in taxes on
Q129: Figure 18-2<br> <img src="https://d2lvgg3v3hfg70.cloudfront.net/TB4193/.jpg" alt="Figure 18-2
Q130: A statistical tool used to measure income
Q131: Table 18-6<br> <img src="https://d2lvgg3v3hfg70.cloudfront.net/TB4193/.jpg" alt="Table 18-6