Multiple Choice
Figure 18-1
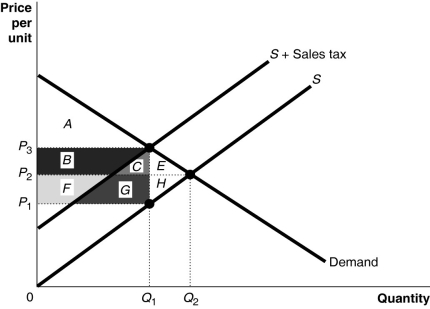
-Refer to Figure 18-1.Area E + H represents
A) the portion of sales tax revenue borne by consumers.
B) the portion of sales tax revenue borne by producers.
C) the excess burden of the sales tax.
D) sales tax revenue collected by the government.
Correct Answer:

Verified
Correct Answer:
Verified
Q155: Table 18-1<br> <img src="https://d2lvgg3v3hfg70.cloudfront.net/TB4193/.jpg" alt="Table 18-1
Q156: The idea that two taxpayers in the
Q157: Which of the following is the largest
Q158: All of the following occur whenever a
Q159: Figure 18-6<br> <img src="https://d2lvgg3v3hfg70.cloudfront.net/TB4193/.jpg" alt="Figure 18-6
Q161: The actual division of a tax between
Q162: Rational ignorance<br>A)explains why consumers ignore sunk costs
Q163: Suppose the equilibrium price and quantity of
Q164: The Arrow impossibility theorem explains<br>A)why there is
Q165: Describe each of the principles governments consider