Multiple Choice
Figure 18-6
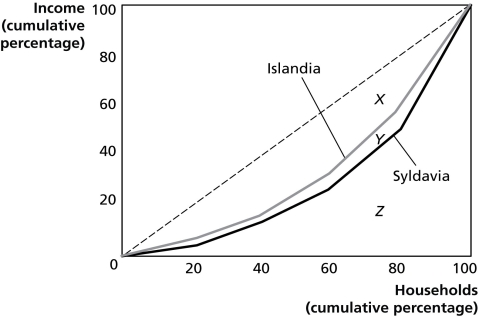
Figure 18-6 shows the Lorenz curves for Islandia and Syldavia.
-Refer to Figure 18-6.If area X = 2,060, area Y = 240, and area Z= 2,700, calculate the Gini coefficient for Syldavia.
A) 0.05
B) 0.12
C) 0.46
D) 0.85
Correct Answer:

Verified
Correct Answer:
Verified
Q154: The average tax rate is calculated as<br>A)total
Q155: Table 18-1<br> <img src="https://d2lvgg3v3hfg70.cloudfront.net/TB4193/.jpg" alt="Table 18-1
Q156: The idea that two taxpayers in the
Q157: Which of the following is the largest
Q158: All of the following occur whenever a
Q160: Figure 18-1<br> <img src="https://d2lvgg3v3hfg70.cloudfront.net/TB4193/.jpg" alt="Figure 18-1
Q161: The actual division of a tax between
Q162: Rational ignorance<br>A)explains why consumers ignore sunk costs
Q163: Suppose the equilibrium price and quantity of
Q164: The Arrow impossibility theorem explains<br>A)why there is