Multiple Choice
You make a phospholipid bilayer with short,saturated hydrocarbon tails.You measure the permeability of this membrane to oxygen.You then double the length of the hydrocarbon tails,and remeasure membrane permeability.You then double the length of the hydrocarbon tails again,and make a third measurement of membrane permeability.You graph membrane permeability as a function of hydrocarbon tail length.Which of the graphs below best represents the data you expect?
A) 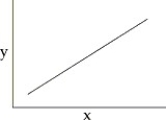
B) 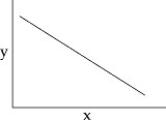
C) 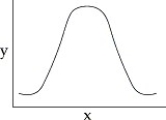
D) 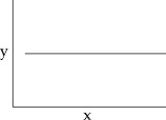
Correct Answer:

Verified
Correct Answer:
Verified
Q14: What will happen to a red blood
Q15: Integral membrane proteins stay in membranes because
Q16: Use the following information when answering the
Q17: Which aspect of phospholipids is most important
Q18: What do phospholipids and triglycerides have in
Q20: What is the most important factor in
Q21: You have a planar bilayer with equal
Q23: Which of the following phospholipid membranes would
Q24: You make a phospholipid bilayer with short,saturated
Q32: Refer to the following paragraph and accompanying