Multiple Choice
You make a phospholipid bilayer with short,saturated hydrocarbon tails.You measure the permeability of this membrane to oxygen.You are going to change the length of the hydrocarbon tails and remeasure membrane permeability,but first your boss asks you to graph the data you expect if there is no effect of hydrocarbon tail length on membrane permeability (your null hypothesis) .Which of the graphs below best represents the data you expect if your null hypothesis is correct?
A) 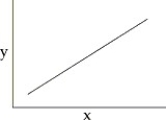
B) 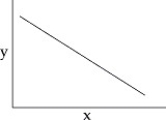
C) 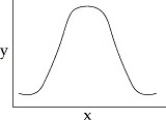
D) 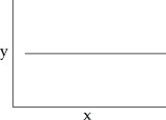
Correct Answer:

Verified
Correct Answer:
Verified
Q19: You make a phospholipid bilayer with short,saturated
Q20: What is the most important factor in
Q21: You have a planar bilayer with equal
Q23: Which of the following phospholipid membranes would
Q25: Phospholipids can form all of the following
Q26: Use the following information when answering the
Q27: Which of the following means of transport
Q28: Steroids such as cholesterol are an important
Q29: Which of the following crosses lipid bilayers
Q32: Refer to the following paragraph and accompanying