Multiple Choice
Figure 55.3 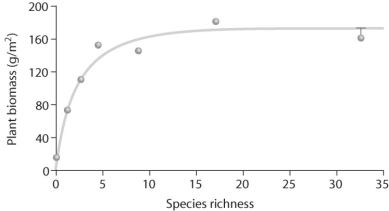
-Upon looking at Figure 55.3,what can you conclude about the data?
A) As species richness changes,plant biomass remains consistent.
B) As species richness increases,plant biomass increases.
C) As species richness increases,plant biomass increases and then levels off.
D) As species richness decreases,plant biomass increases.
Correct Answer:

Verified
Correct Answer:
Verified
Q23: Which of the following statements regarding extinction
Q24: Figure 55.2 <img src="https://d2lvgg3v3hfg70.cloudfront.net/TB3734/.jpg" alt="Figure 55.2
Q25: Which of the following is a likely
Q26: Which of the following is the true
Q27: You discover,in your massive 2000-hectare forest,a species
Q29: What are the criteria Conservation International has
Q30: Figure 55.5 <img src="https://d2lvgg3v3hfg70.cloudfront.net/TB3734/.jpg" alt="Figure 55.5
Q31: How can biodiversity affect the way we
Q32: Figure 55.7 <img src="https://d2lvgg3v3hfg70.cloudfront.net/TB3734/.jpg" alt="Figure 55.7
Q33: Philippe Bouchet and colleagues conducted a massive