Multiple Choice
Figure 55.5 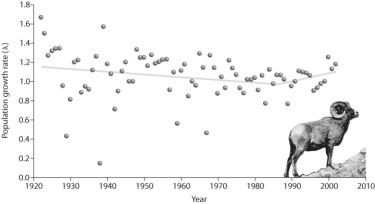
-According to Figure 55.5,what is the least likely explanation for the data after 1985?
A) emigration
B) immigration
C) introduction of new individuals to the population
D) increased resources in the area
Correct Answer:

Verified
Correct Answer:
Verified
Q25: Which of the following is a likely
Q26: Which of the following is the true
Q27: You discover,in your massive 2000-hectare forest,a species
Q28: Figure 55.3 <img src="https://d2lvgg3v3hfg70.cloudfront.net/TB3734/.jpg" alt="Figure 55.3
Q29: What are the criteria Conservation International has
Q31: How can biodiversity affect the way we
Q32: Figure 55.7 <img src="https://d2lvgg3v3hfg70.cloudfront.net/TB3734/.jpg" alt="Figure 55.7
Q33: Philippe Bouchet and colleagues conducted a massive
Q34: Which one of the following is likely
Q35: Which of the following criteria have to