Multiple Choice
Figure 12.1
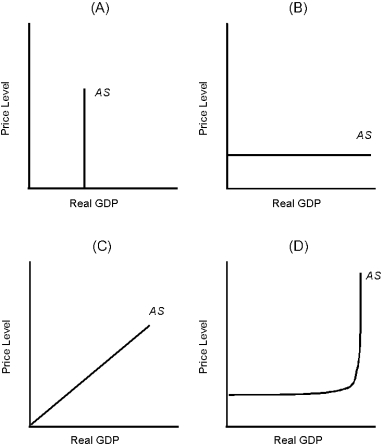
-Which of the graphs in Figure 12.1 is consistent with long-run equilibrium analysis?
A) A
B) B
C) C
D) D
E) None of these
Correct Answer:

Verified
Correct Answer:
Verified
Related Questions
Q48: The wealth effect and the interest rate
Q85: The inverse relationship between the general price
Q87: The wealth effect refers to the fact
Q88: Figure 12.4<br> <img src="https://d2lvgg3v3hfg70.cloudfront.net/TB1749/.jpg" alt="Figure 12.4
Q89: The long-run aggregate supply curve at the
Q91: Which of the following would cause cost-push
Q92: Figure 12.2<br> <img src="https://d2lvgg3v3hfg70.cloudfront.net/TB1749/.jpg" alt="Figure 12.2
Q93: The aggregate supply curve relates real national
Q94: All of the following will cause the
Q95: In the 1970s, the world price of