Multiple Choice
Figure 12.2
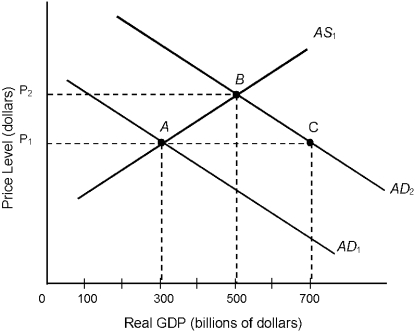
-Consider the economy described in Figure 12.2. The shift in aggregate demand from AD1 to AD2 could have been initiated by
A) a decrease in the price level.
B) an increase in saving.
C) government budget cuts.
D) an increase in autonomous net exports.
E) lower resource prices.
Correct Answer:

Verified
Correct Answer:
Verified
Q87: The wealth effect refers to the fact
Q88: Figure 12.4<br> <img src="https://d2lvgg3v3hfg70.cloudfront.net/TB1749/.jpg" alt="Figure 12.4
Q89: The long-run aggregate supply curve at the
Q90: Figure 12.1<br> <img src="https://d2lvgg3v3hfg70.cloudfront.net/TB1749/.jpg" alt="Figure 12.1
Q91: Which of the following would cause cost-push
Q93: The aggregate supply curve relates real national
Q94: All of the following will cause the
Q95: In the 1970s, the world price of
Q96: Figure 12.2<br> <img src="https://d2lvgg3v3hfg70.cloudfront.net/TB1749/.jpg" alt="Figure 12.2
Q97: All of the following would cause an