Multiple Choice
Figure 7-1
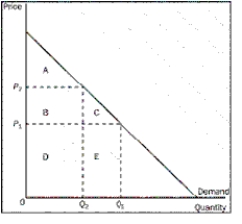
-Refer to Figure 7-1.What does area C represent
A) the decrease in consumer surplus to new consumers who enter the market when the price falls from P₂ to P₁
B) the increase in consumer surplus to new consumers who enter the market when the price falls from P₂ to P₁
C) an increase in producer surplus when quantity sold increases from Q₂ to Q₁
D) a decrease in consumer surplus to each consumer in the market when the price falls from P₂ to P₁
Correct Answer:

Verified
Correct Answer:
Verified
Q2: When technology improves in the ice cream
Q3: What are externalities<br>A)side effects passed on to
Q4: Chad is willing to pay $5.00 to
Q5: Figure 7-1<br> <img src="https://d2lvgg3v3hfg70.cloudfront.net/TB1272/.jpg" alt="Figure 7-1
Q6: Answer the following questions based on the
Q8: What do the decisions of buyers and
Q9: Table 7-1<br> <img src="https://d2lvgg3v3hfg70.cloudfront.net/TB1272/.jpg" alt="Table 7-1
Q10: Figure 7-8<br> <img src="https://d2lvgg3v3hfg70.cloudfront.net/TB1272/.jpg" alt="Figure 7-8
Q11: Figure 7-1<br> <img src="https://d2lvgg3v3hfg70.cloudfront.net/TB1272/.jpg" alt="Figure 7-1
Q12: Figure 7-6<br><br> <img src="https://d2lvgg3v3hfg70.cloudfront.net/TB1272/.jpg" alt="Figure 7-6