Essay
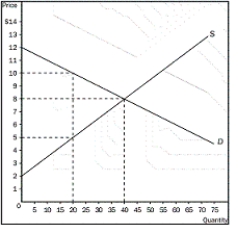
Answer the following questions based on the graph that represents JR's weekly demand for ribs at Judy's Rib Shack.
a.At equilibrium price,how many ribs would JR be willing to purchase
b.How much is JR willing to pay for 20 ribs
c.How much would JR's consumer surplus be at the equilibrium price
d.At the equilibrium price,how many ribs would Judy be willing to sell
e.How much must the price of ribs be for Judy to supply 20 ribs to the market
f.At the equilibrium price,what is total surplus in the market
g.If the price of ribs rose to $10,what would happen to JR's consumer surplus
h.If the price of ribs fell to $5,what would happen to Judy's producer surplus
i.Explain why the graph shown verifies the fact that the market equilibrium (quantity) maximizes the sum of producer and consumer surplus.
Correct Answer:

Verified
a. 40
b. $10
c. $80
d. 40
e. $5
f. $200
...View Answer
Unlock this answer now
Get Access to more Verified Answers free of charge
Correct Answer:
Verified
b. $10
c. $80
d. 40
e. $5
f. $200
...
View Answer
Unlock this answer now
Get Access to more Verified Answers free of charge
Q1: Table 7-4<br> <img src="https://d2lvgg3v3hfg70.cloudfront.net/TB1272/.jpg" alt="Table 7-4
Q2: When technology improves in the ice cream
Q3: What are externalities<br>A)side effects passed on to
Q4: Chad is willing to pay $5.00 to
Q5: Figure 7-1<br> <img src="https://d2lvgg3v3hfg70.cloudfront.net/TB1272/.jpg" alt="Figure 7-1
Q7: Figure 7-1<br> <img src="https://d2lvgg3v3hfg70.cloudfront.net/TB1272/.jpg" alt="Figure 7-1
Q8: What do the decisions of buyers and
Q9: Table 7-1<br> <img src="https://d2lvgg3v3hfg70.cloudfront.net/TB1272/.jpg" alt="Table 7-1
Q10: Figure 7-8<br> <img src="https://d2lvgg3v3hfg70.cloudfront.net/TB1272/.jpg" alt="Figure 7-8
Q11: Figure 7-1<br> <img src="https://d2lvgg3v3hfg70.cloudfront.net/TB1272/.jpg" alt="Figure 7-1