Multiple Choice
Figure 8-1
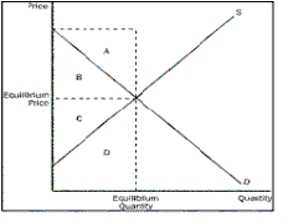
-Refer to Figure 8-1.Which area represents total economic surplus
A) A + B
B) B + C
C) C + D
D) A + D
Correct Answer:

Verified
Correct Answer:
Verified
Q38: Figure 8-6<br> <img src="https://d2lvgg3v3hfg70.cloudfront.net/TB1272/.jpg" alt="Figure 8-6
Q39: If income tax rates in Sweden had
Q40: Figure 8-4<br> <img src="https://d2lvgg3v3hfg70.cloudfront.net/TB1272/.jpg" alt="Figure 8-4
Q41: Figure 8-5<br> <img src="https://d2lvgg3v3hfg70.cloudfront.net/TB1272/.jpg" alt="Figure 8-5
Q42: Figure 8-6<br> <img src="https://d2lvgg3v3hfg70.cloudfront.net/TB1272/.jpg" alt="Figure 8-6
Q44: What does the Laffer curve do<br>A)It relates
Q45: Figure 8-5<br> <img src="https://d2lvgg3v3hfg70.cloudfront.net/TB1272/.jpg" alt="Figure 8-5
Q46: If the size of a tax doubles,the
Q47: What is the relationship between the deadweight
Q48: What should be used to analyze economic