Multiple Choice
Figure 8-4
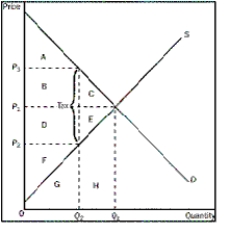
-Refer to Figure 8-4.Assume the tax was levied on the producer.Which area represents the reduction in producer surplus
A) A
B) B + C
C) D + E
D) D + E + F
Correct Answer:

Verified
Correct Answer:
Verified
Q35: Using the graph shown,determine each of the
Q36: Figure 8-6<br> <img src="https://d2lvgg3v3hfg70.cloudfront.net/TB1272/.jpg" alt="Figure 8-6
Q37: Taxes cause deadweight losses because they prevent
Q38: Figure 8-6<br> <img src="https://d2lvgg3v3hfg70.cloudfront.net/TB1272/.jpg" alt="Figure 8-6
Q39: If income tax rates in Sweden had
Q41: Figure 8-5<br> <img src="https://d2lvgg3v3hfg70.cloudfront.net/TB1272/.jpg" alt="Figure 8-5
Q42: Figure 8-6<br> <img src="https://d2lvgg3v3hfg70.cloudfront.net/TB1272/.jpg" alt="Figure 8-6
Q43: Figure 8-1<br><br> <img src="https://d2lvgg3v3hfg70.cloudfront.net/TB1272/.jpg" alt="Figure 8-1
Q44: What does the Laffer curve do<br>A)It relates
Q45: Figure 8-5<br> <img src="https://d2lvgg3v3hfg70.cloudfront.net/TB1272/.jpg" alt="Figure 8-5