Multiple Choice
Figure 8-4
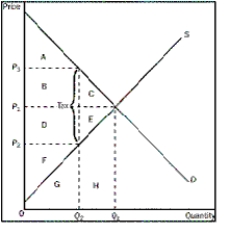
-Refer to Figure 8-4.Which area represents producer surplus after the tax is levied on the consumer
A) A
B) A + B + C
C) D + E
D) F
Correct Answer:

Verified
Correct Answer:
Verified
Related Questions
Q23: Figure 8-5<br> <img src="https://d2lvgg3v3hfg70.cloudfront.net/TB1272/.jpg" alt="Figure 8-5
Q24: Figure 8-3<br> <img src="https://d2lvgg3v3hfg70.cloudfront.net/TB1272/.jpg" alt="Figure 8-3
Q25: Assume that the supply of gasoline is
Q26: Suppose that instead of a supply-demand diagram,you
Q27: Which outcome will occur as a result
Q29: When will buyers of a product pay
Q30: Normally,both buyers and sellers are worse off
Q31: What effect does a tax placed on
Q32: Use the following graph shown to fill
Q33: What effect does a tax levied on