menu-iconExamlexExamLexServices

Discover

Ask a Question
  1. All Topics
  2. Topic
    Business
  3. Study Set
    Principles of Microeconomics
  4. Exam
    Exam 8: Application: the Costs of Taxation
  5. Question
    Use the Following Graph Shown to Fill in the Table
Solved

Use the Following Graph Shown to Fill in the Table

Question 32

Question 32

Essay

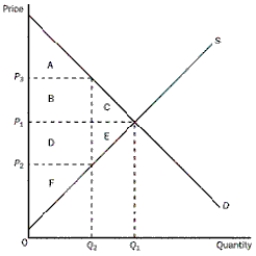
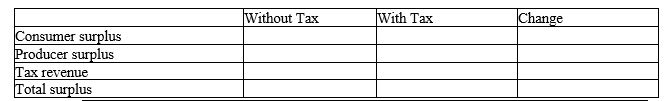
Use the following graph shown to fill in the table that follows.

Correct Answer:

verifed

Verified

Unlock this answer now
Get Access to more Verified Answers free of charge

Related Questions

Q27: Which outcome will occur as a result

Q28: Figure 8-4<br> <img src="https://d2lvgg3v3hfg70.cloudfront.net/TB1272/.jpg" alt="Figure 8-4

Q29: When will buyers of a product pay

Q30: Normally,both buyers and sellers are worse off

Q31: What effect does a tax placed on

Q33: What effect does a tax levied on

Q34: Assuming that the demand for diamonds is

Q35: Using the graph shown,determine each of the

Q36: Figure 8-6<br> <img src="https://d2lvgg3v3hfg70.cloudfront.net/TB1272/.jpg" alt="Figure 8-6

Q37: Taxes cause deadweight losses because they prevent

Examlex

ExamLex

About UsContact UsPerks CenterHomeschoolingTest Prep

Work With Us

Campus RepresentativeInfluencers

Links

FaqPricingChrome Extension

Download The App

Get App StoreGet Google Play

Policies

Privacy PolicyTerms of ServiceHonor CodeCommunity Guidelines

Scan To Download

qr-code

Copyright © (2025) ExamLex LLC.

Privacy PolicyTerms Of ServiceHonor CodeCommunity Guidelines