Multiple Choice
Use the figure below to answer the following question(s) .
Figure 4-7
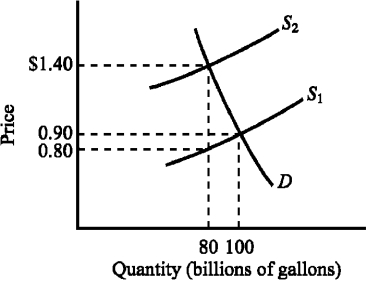
-Refer to Figure 4-7.The supply curve S₁ and the demand curve D indicate initial conditions in the market for gasoline.A $.60-per-gallon excise tax on gasoline is levied.How much revenue does the $.60-per-gallon tax generate for the government?
A) $40 billion
B) $48 billion
C) $50 billion
D) $60 billion
Correct Answer:

Verified
Correct Answer:
Verified
Q1: Currently, federal and state gasoline taxes (imposed
Q21: The "incidence of a tax" is the
Q92: A payment the government makes to either
Q137: Both price floors and price ceilings, when
Q143: A regressive tax<br>A) taxes individuals with higher
Q150: Figure 4-22 <img src="https://d2lvgg3v3hfg70.cloudfront.net/TB7348/.jpg" alt="Figure 4-22
Q154: The benefit of a subsidy will go
Q159: Use the table below to choose the
Q274: In the two decades following 1990, subsidized
Q283: A tax is levied on products A