Multiple Choice
Use the figure below to answer the following question.
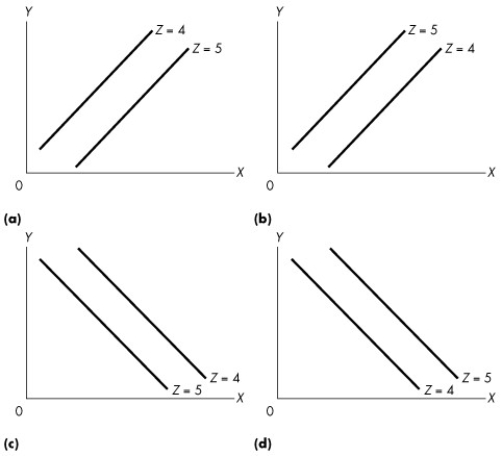
Figure 1A.4.1
-Given the data in the following table, which one of the graphs in Figure 1A.4.1 correctly represents the relationship among x, y, and z?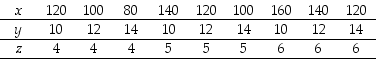
A) (a)
B) (b)
C) (c)
D) (d)
E) (b) and (c)
Correct Answer:

Verified
Correct Answer:
Verified
Related Questions
Q2: When a firm decides to produce computers
Q44: Which of the following statements are positive?
Q54: A good economic model<br>A)does not include more
Q80: Use the figure below to answer the
Q83: Which of the following equations describes a
Q86: Use the figure below to answer the
Q87: Use the figure below to answer the
Q88: During the next hour John can choose
Q115: Use the figure below to answer the
Q202: A normative statement is a statement regarding<br>A)what