Multiple Choice
Use the figure below to answer the following questions.
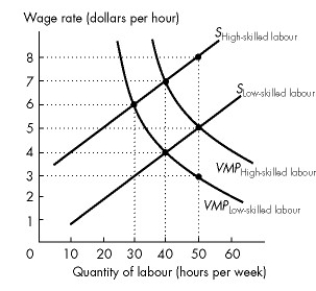
Figure 19.3.5
-Refer to Figure 19.3.5. This figure shows the labour supply curves and the value of marginal product curves for high-skilled and low-skilled workers. The equilibrium wage rate for high-skilled workers is
A) $5 an hour.
B) $4 an hour.
C) $6 an hour.
D) $8 an hour.
E) $7 an hour.
Correct Answer:

Verified
Correct Answer:
Verified
Q21: Wealth differs from income because<br>A)income is a
Q61: The tax system at both the federal
Q84: Which one of the following is not
Q114: Use the figure below to answer the
Q116: Use the figure below to answer the
Q117: The wealthiest 10 percent of Canadian families
Q118: Use the figure below to answer the
Q119: Use the figure below to answer the
Q120: In 2011, the median household income in
Q122: Use the figure below to answer the