Multiple Choice
Use the figure below to answer the following questions.
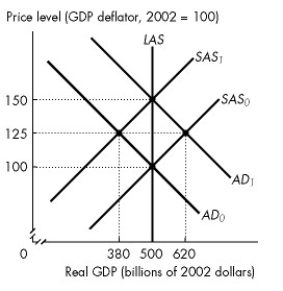
Figure 28.2.3
-Refer to Figure 28.2.3. Assume that the figure illustrates an economy initially in equilibrium at the intersection of the SAS₀ curve and the AD₀ curve. If the aggregate demand curve is expected to remain at AD₀ but shifts to AD₁, the new equilibrium real GDP is ________ and the new equilibrium price level is ________.
A) $380 billion; 125
B) $500 billion; 150
C) $500 billion; 100
D) $620 billion; 125
E) $500 billion; 125
Correct Answer:

Verified
Correct Answer:
Verified
Q56: The Canadian short-run Phillips curve _ when
Q57: Choose the statement that is incorrect.<br>A)An economy
Q58: A forecast based on all the relevant
Q59: Use the figure below to answer the
Q60: Stagflation is the result of<br>A)a decrease in
Q62: Use the figure below to answer the
Q63: For a given expected inflation rate, the
Q64: Along the short-run Phillips curve, if the
Q65: Use the figure below to answer the
Q66: Use the table below to answer the