Multiple Choice
Use the figure below to answer the following questions.
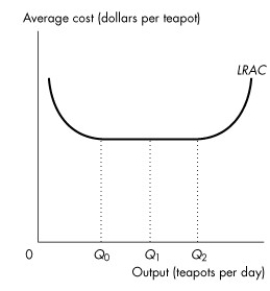
Figure 11.4.4
-Refer to Figure 11.4.4, which illustrates the long-run average total cost curve. Which one of the following statements is false?
A) Economies of scale exist between 0 and Q₀ units of output.
B) Diseconomies of scale exist between 0 and Q₁ units of output.
C) Constant returns to scale exist between Q₁ and Q₂ units of output.
D) Diseconomies of scale exist at quantities greater than Q₂ units of output.
E) Constant returns to scale exist between Q₀ and Q₁ units of output.
Correct Answer:

Verified
Correct Answer:
Verified
Q10: Plant refers to those factors of production<br>A)that
Q45: A rise in the price of a
Q51: Ernie's Earmuffs produces 200 earmuffs per year
Q63: Use the table below to answer the
Q66: Use the figure below to answer the
Q67: Use the table below to answer the
Q69: A production function is the relationship between
Q70: Use the figure below to answer the
Q72: Use the information below to answer the
Q134: If an increase in output from 5