Multiple Choice
Figure 18-7
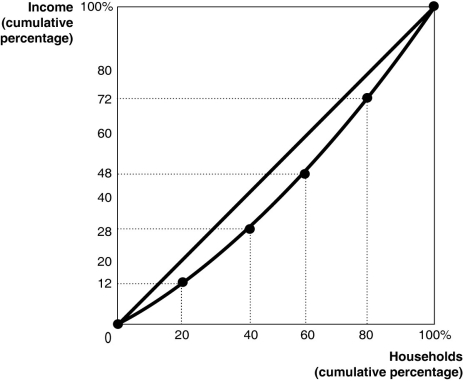
Figure 18-7 shows the Lorenz curve for a hypothetical country.
-Refer to Figure 18-7.The second lowest 20 percent of households
A) earn 12 percent of the society's total income.
B) earn 16 percent of the society's total income.
C) earn 28 percent of the society's total income.
D) earn 40 percent of the society's total income.
Correct Answer:

Verified
Correct Answer:
Verified
Q197: One result of the public choice model
Q198: When the demand for a product is
Q199: If your income is $92,000 and you
Q200: Measures of poverty (for example, the poverty
Q201: The Gini coefficient for the United States
Q203: What is the relationship between market failure
Q204: During the past 30 years, income inequality
Q205: Logrolling may result in<br>A)legislation that yields economy-wide
Q206: Figure 18-2<br> <img src="https://d2lvgg3v3hfg70.cloudfront.net/TB4193/.jpg" alt="Figure 18-2
Q207: When the demand for a product is