Multiple Choice
Figure 3-2
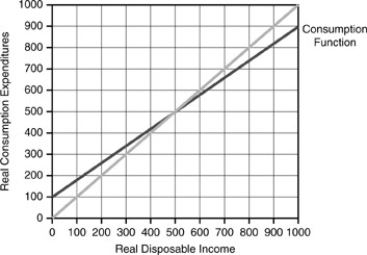
-Employing the information in Figure 3-2 above,when real disposable income is 1000,savings from households would be ________ and the marginal propensity to save would be ________.
A) 300;0.1
B) 100;0.2
C) 100;0.1
D) 500;0.2
Correct Answer:

Verified
Correct Answer:
Verified
Q138: Figure 3-7<br> <img src="https://d2lvgg3v3hfg70.cloudfront.net/TB2645/.jpg" alt="Figure 3-7
Q139: Figure 3-7<br> <img src="https://d2lvgg3v3hfg70.cloudfront.net/TB2645/.jpg" alt="Figure 3-7
Q140: In equilibrium,with exports equal to imports it
Q141: In the development of the IS curve,one
Q142: If Y = $200 billion,c = 0.75,autonomous
Q144: The size of the multiplier depends in
Q145: Total planned expenditures are<br>A)C + Ip.<br>B)Ep +
Q146: A 45-degree line on a graph with
Q147: When an economy is in equilibrium,<br>A)planned expenditures
Q148: The saving function is<br>A)cY.<br>B)Y - T.<br>C)(1 -