Multiple Choice
Figure 3-7
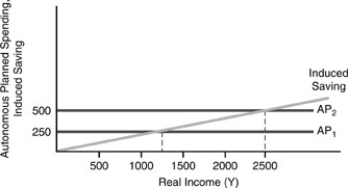
-In Figure 3-7 above,the multiplier effect does NOT explain
A) the increase in equilibrium income.
B) the increase in induced saving.
C) the increase in AP.
D) all of the above.
Correct Answer:

Verified
Correct Answer:
Verified
Q133: Figure 3-4<br> <img src="https://d2lvgg3v3hfg70.cloudfront.net/TB2645/.jpg" alt="Figure 3-4
Q134: When planned autonomous spending rises,the planned expenditure
Q135: A marginal propensity to consume of 0.84
Q136: In the 2000s,low savings rates are attributed
Q137: If autonomous planned spending increases by $1
Q139: Figure 3-7<br> <img src="https://d2lvgg3v3hfg70.cloudfront.net/TB2645/.jpg" alt="Figure 3-7
Q140: In equilibrium,with exports equal to imports it
Q141: In the development of the IS curve,one
Q142: If Y = $200 billion,c = 0.75,autonomous
Q143: Figure 3-2<br> <img src="https://d2lvgg3v3hfg70.cloudfront.net/TB2645/.jpg" alt="Figure 3-2