Multiple Choice
Figure 3-4
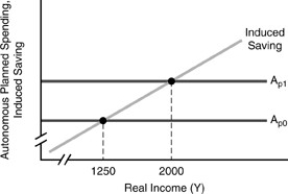
-In Figure 3-4 above,the shift from AP₀ to AP₁ could have been caused by a ________ in T of ________.
A) fall,300
B) fall,180
C) fall,500
D) rise,300
E) rise,500
Correct Answer:

Verified
Correct Answer:
Verified
Q128: The "equilibrating mechanism," the reason the economy
Q129: Changes in consumer confidence,business optimism,government spending,and foreign
Q130: Figure 3-2<br> <img src="https://d2lvgg3v3hfg70.cloudfront.net/TB2645/.jpg" alt="Figure 3-2
Q131: What type of variables have their movements
Q132: A fixed or rigid price level implies<br>A)that
Q134: When planned autonomous spending rises,the planned expenditure
Q135: A marginal propensity to consume of 0.84
Q136: In the 2000s,low savings rates are attributed
Q137: If autonomous planned spending increases by $1
Q138: Figure 3-7<br> <img src="https://d2lvgg3v3hfg70.cloudfront.net/TB2645/.jpg" alt="Figure 3-7