Multiple Choice
Figure 8-6
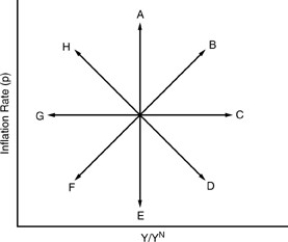
-In Figure 8-6 above,the one year since 1970 that the U.S.economy managed to travel along path E was
A) 1971.
B) 1970.
C) 1979.
D) 1986.
Correct Answer:

Verified
Correct Answer:
Verified
Related Questions
Q138: If the SP curve is steep then
Q139: When the expected rate of inflation falls,the
Q140: Given an adverse supply shock,an "accommodating policy"
Q141: The "indirect effect" of a beneficial supply
Q142: Assuming adaptive expectations,a "cold turkey" reduction in
Q144: The economy is in long-run equilibrium<br>A)at any
Q145: Figure 8-5<br> <img src="https://d2lvgg3v3hfg70.cloudfront.net/TB2645/.jpg" alt="Figure 8-5
Q146: The "indirect effect" of an adverse supply
Q147: Suppose that the government enforced a law
Q148: The growth of nominal GDP<br>A)can be broken