Multiple Choice
Figure 8-5
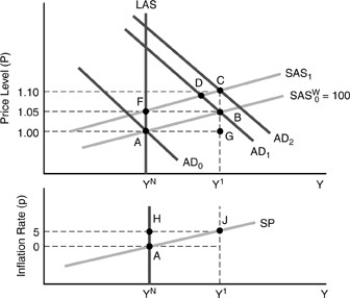
-In Figure 8-5 above,in going from points A to B the real wage ________,and then from point B to point C (where the exact price level is 1.1025,rounded to 1.10 in the diagram) the real wage ________.
A) rose,remained constant
B) rose,rose again
C) fell,remained constant
D) fell,fell again
E) remained constant,remained constant
Correct Answer:

Verified
Correct Answer:
Verified
Q140: Given an adverse supply shock,an "accommodating policy"
Q141: The "indirect effect" of a beneficial supply
Q142: Assuming adaptive expectations,a "cold turkey" reduction in
Q143: Figure 8-6<br> <img src="https://d2lvgg3v3hfg70.cloudfront.net/TB2645/.jpg" alt="Figure 8-6
Q144: The economy is in long-run equilibrium<br>A)at any
Q146: The "indirect effect" of an adverse supply
Q147: Suppose that the government enforced a law
Q148: The growth of nominal GDP<br>A)can be broken
Q149: Figure 8-6<br> <img src="https://d2lvgg3v3hfg70.cloudfront.net/TB2645/.jpg" alt="Figure 8-6
Q150: Figure 8-2<br> <img src="https://d2lvgg3v3hfg70.cloudfront.net/TB2645/.jpg" alt="Figure 8-2