Multiple Choice
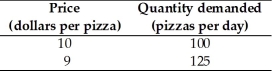
-The data in the table above give two points on the demand curve for pizza.Using the midpoint method,when the price of a pizza falls from $10 to $9,what is the percentage change in price?
A) 8.2 percent
B) 15.5 percent
C) 10.5 percent
D) 5.0 percent
E) 1.0 percent
Correct Answer:

Verified
Correct Answer:
Verified
Q26: <img src="https://d2lvgg3v3hfg70.cloudfront.net/TB1458/.jpg" alt=" -The demand curve
Q42: Suppose the University of Oklahoma increases the
Q43: The price elasticity of demand for Red
Q44: If a 10 percent increase in income
Q48: The total revenue test says that if
Q49: The demand for a necessity generally is<br>A)
Q50: For a good such as food,the income
Q51: When income increases from $20,000 to $30,000
Q52: <img src="https://d2lvgg3v3hfg70.cloudfront.net/TB1458/.jpg" alt=" -A firm raises
Q260: <img src="https://d2lvgg3v3hfg70.cloudfront.net/TB8586/.jpg" alt=" -The figure above