Multiple Choice
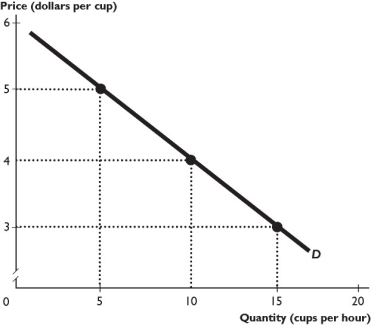
The figure above shows the demand curve for Starbucks latte.
-In in the figure above,when the price rises from $3 to $4,the price elasticity of demand is
A) 1.4.
B) 2.
C) 0.71.
D) 0.4.
E) 1.
Correct Answer:

Verified
Correct Answer:
Verified
Related Questions
Q6: The price elasticity of demand for an
Q51: When income increases from $20,000 to $30,000
Q60: The price elasticity of supply is a
Q74: If the income elasticity of demand for
Q93: Goods are _ when the income elasticity
Q144: If the quantity supplied increases by 8
Q176: <img src="https://d2lvgg3v3hfg70.cloudfront.net/TB8586/.jpg" alt=" -The table above
Q260: <img src="https://d2lvgg3v3hfg70.cloudfront.net/TB8586/.jpg" alt=" -The figure above
Q326: When the percentage change in the quantity
Q437: You are the brand manager of Crest