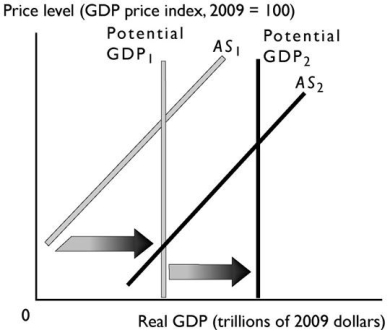
Multiple Choice

The change in potential real GDP and aggregate supply shown in the graph above can be a result of
A) a decrease in the money price of oil.
B) an increase in the real wage rate.
C) a fall in the price level.
D) a decrease in the money wage rate.
E) an increase in the quantity of capital.
Correct Answer:

Verified
Correct Answer:
Verified
Q5: If firms' expectations about the future become
Q20: When the price level rises and increases
Q28: If profits are high because the price
Q64: The aggregate supply curve is a(n) _
Q76: An increase in _ increases potential GDP
Q79: <img src="https://d2lvgg3v3hfg70.cloudfront.net/TB1012/.jpg" alt=" -In the figure
Q83: Changes in which of the following do
Q85: Which of the following best describes the
Q87: During 2014,a country reports that its price
Q88: A rise in the price level _