Multiple Choice
Figure 2-5
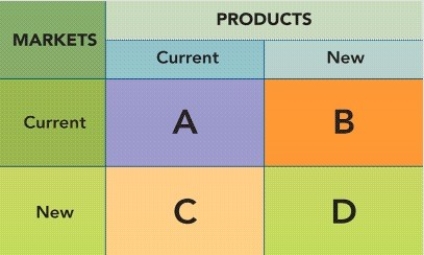
-The image depicted in Figure 2-5 above represents what strategic analysis technique?
A) Gantt chart
B) SWOT analysis
C) Pert chart
D) BCG growth-share matrix
E) Diversification analysis
Correct Answer:

Verified
Correct Answer:
Verified
Q34: Explain what a Gantt chart is and
Q127: The specialists within an organization who actually
Q168: According to the textbook, the terms firm,
Q223: An action item list refers to an
Q224: Figure 2-11<br> <img src="https://d2lvgg3v3hfg70.cloudfront.net/TB1242/.jpg" alt="Figure 2-11
Q225: Figure 2-2<br> <img src="https://d2lvgg3v3hfg70.cloudfront.net/TB1242/.jpg" alt="Figure 2-2
Q226: In a BCG growth-share matrix,a relative market
Q227: If Ben & Jerry's sold a line
Q231: Eileen Fisher is a leader in sustainable
Q233: Figure 2-7<br> <img src="https://d2lvgg3v3hfg70.cloudfront.net/TB1242/.jpg" alt="Figure 2-7