Multiple Choice
Figure 2-11
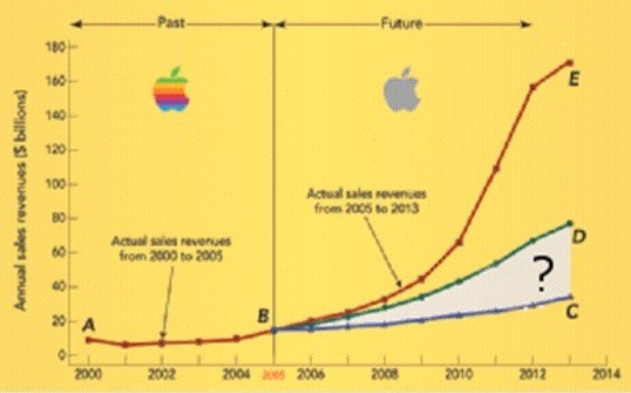
-Based on the information in Figure 2-11 above,the planning gap between 2005 and 2013,as represented by the wedge DBC
A) is widening.
B) is narrowing.
C) is staying the same.
D) cannot be quantified.
E) began to open in 1998.
Correct Answer:

Verified
Correct Answer:
Verified
Q21: Market share is the ratio of sales
Q34: Explain what a Gantt chart is and
Q219: The organizational _ answers the question,"What will
Q221: Statements of an accomplishment of a task
Q222: Figure 2-2<br> <img src="https://d2lvgg3v3hfg70.cloudfront.net/TB1242/.jpg" alt="Figure 2-2
Q223: An action item list refers to an
Q225: Figure 2-2<br> <img src="https://d2lvgg3v3hfg70.cloudfront.net/TB1242/.jpg" alt="Figure 2-2
Q226: In a BCG growth-share matrix,a relative market
Q227: If Ben & Jerry's sold a line
Q228: Figure 2-5<br> <img src="https://d2lvgg3v3hfg70.cloudfront.net/TB1242/.jpg" alt="Figure 2-5