Multiple Choice
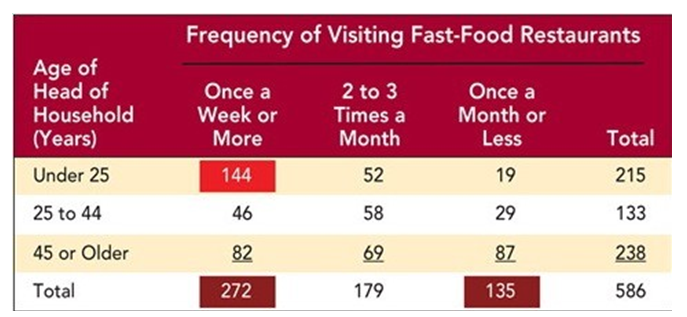
Figure 8-6A
-Consider Figure 8-6A above.Suppose you are an owner of a local Wendy's restaurant near a large urban college or university.You hired a marketing research firm to conduct a survey among a sample of respondents in your area to find out their patronage of fast-food restaurants.Four weeks after the firm conducted the survey,it presented the following results to you.What does this figure represent?
A) a trend extrapolation
B) a Likert scale report
C) a perceptual map
D) a cross tabulation
E) a marketing input report
Correct Answer:

Verified
Correct Answer:
Verified
Q29: A cross tabulation refers to<br>A) the selection
Q45: Marketing teams must be vigilant in looking
Q90: Observing people and asking them questions are
Q157: All of the following are sources of
Q162: Qualified members of tracking studies for a
Q163: Grape-Nuts was one of the first cereals
Q165: Filmmakers want movie titles that use the
Q184: What are the three actions a marketing
Q195: Specifying constraints, identifying data needed for marketing
Q275: Questionnaire data are<br>A) the facts and figures