Multiple Choice
Figure 13-4B
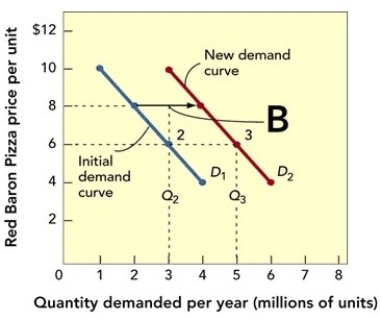
-Which of the following would most likely account for the shift in the demand curve from D₂ to D₃ shown in Figure 13-4B above?
A) The firm increased its prices and consumers perceived the value of the product to be greater.
B) There were more product substitutes available in the marketplace.
C) Competitors in the market lowered their prices.
D) A recession occurred that lowered consumers' incomes.
E) The product became trendy among members of its target market.
Correct Answer:

Verified
Correct Answer:
Verified
Q19: Basic to setting a product's price is
Q26: The particular type of competition dramatically influences
Q27: The percentage change in quantity demanded relative
Q49: Recently,much of the Western United States experienced
Q51: Figure 13-4B<br> <img src="https://d2lvgg3v3hfg70.cloudfront.net/TB1242/.jpg" alt="Figure 13-4B
Q52: Figure 13-4A<br> <img src="https://d2lvgg3v3hfg70.cloudfront.net/TB1242/.jpg" alt="Figure 13-4A
Q118: Marketing executives must translate estimates of customer
Q127: The horizontal axis of a demand curve
Q136: Companies must know or anticipate what specific
Q163: A firm may forgo a higher profit