Multiple Choice
Figure 13-7
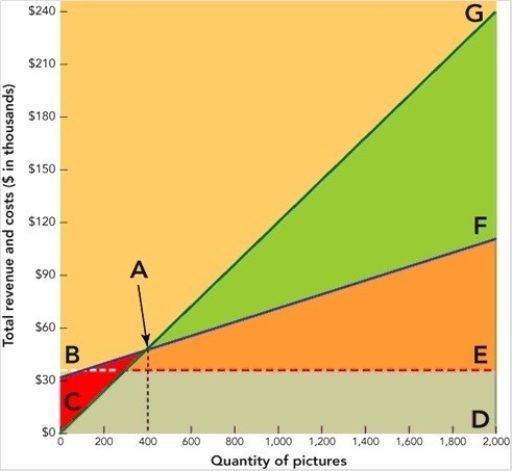
-In the break-even chart in Figure 13-7 above,the triangular area GAF represents the firm's
A) fixed costs.
B) break-even point.
C) variable costs.
D) profit.
E) total revenue.
Correct Answer:

Verified
Correct Answer:
Verified
Related Questions
Q15: Economists have identified four types of competitive
Q61: Which of the following are elements involved
Q62: Washburn Guitars markets its guitars to four
Q206: Occasionally, prices may rise later in the
Q212: General Motors and Chrysler experienced financial distress
Q218: Which of the following is a typical
Q219: Apple's iPhone was originally a single model
Q220: If a McDonald's menu board advertises Mini
Q222: Fixed cost refers to<br>A)the sum of the
Q232: To increase value the most, marketers should<br>A)