Multiple Choice
Figure 3-8
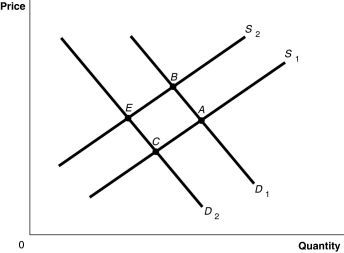
-Refer to Figure 3-8.The graph in this figure illustrates an initial competitive equilibrium in the market for apples at the intersection of D1 and S1 (point A) If there is an increase in the wages of apple workers and an increase in the price of oranges, a substitute for apples, the equilibrium could move to which point?
A) none of the points shown
B) B
C) C
D) E
Correct Answer:

Verified
Correct Answer:
Verified
Q82: What is the difference between an "increase
Q89: Figure 3-7<br> <img src="https://d2lvgg3v3hfg70.cloudfront.net/TB4193/.jpg" alt="Figure 3-7
Q94: A supply schedule<br>A) is a table that
Q100: Technological advances have resulted in lower prices
Q115: Which of the following is expected to
Q155: When the price of a good falls,
Q158: Figure 3-7<br> <img src="https://d2lvgg3v3hfg70.cloudfront.net/TB4193/.jpg" alt="Figure 3-7
Q162: A movement along the demand curve for
Q195: If consumers believe the price of iPads
Q232: Figure 3-7<br> <img src="https://d2lvgg3v3hfg70.cloudfront.net/TB4193/.jpg" alt="Figure 3-7