Multiple Choice
Table 20-8
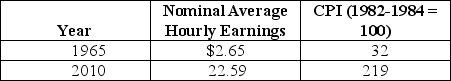
The table above reports the nominal average hourly earnings in private industry and the consumer price index for 1965 and 2010.
-Refer to Table 20-8.The percentage change in real average earnings from 1965 to 2010 equals
A) 2.0 percent
B) 19.7 percent.
C) 24.5 percent.
D) 80.3 percent.
Correct Answer:

Verified
Correct Answer:
Verified
Q12: Table 20-10<br> <img src="https://d2lvgg3v3hfg70.cloudfront.net/TB2849/.jpg" alt="Table 20-10
Q15: Suppose the labor force stays constant,and the
Q16: Table 20-9<br> <img src="https://d2lvgg3v3hfg70.cloudfront.net/TB2849/.jpg" alt="Table 20-9
Q18: Table 20-3<br> <img src="https://d2lvgg3v3hfg70.cloudfront.net/TB2849/.jpg" alt="Table 20-3
Q66: Which of the following would decrease the
Q77: If inflation is positive and is perfectly
Q102: The producer price index measures the prices
Q148: The Bureau of Labor Statistics does not
Q180: Which of the following cause the unemployment
Q274: If the minimum wage is set above